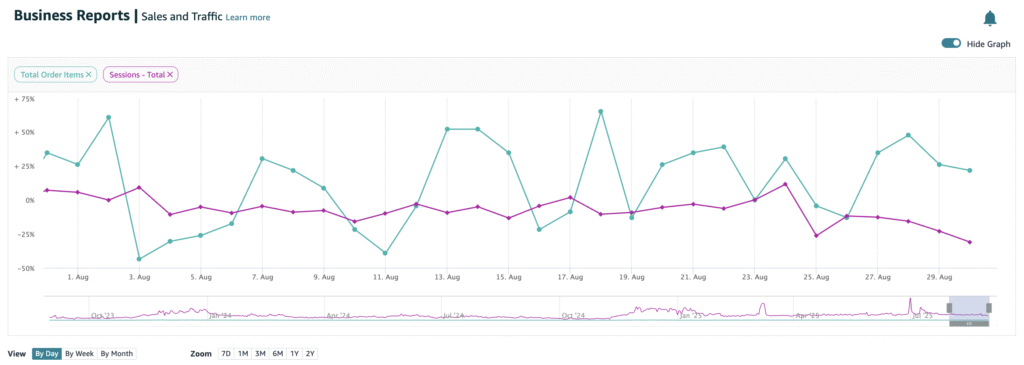
One of the most critical steps to succeed on Amazon is being able to analyze sales and performance data accurately. The Business Reports section in Seller Central allows you to see the traffic and conversion rates of your product listings. For example, the “Detail Page Sales and Traffic” report shows how many people visited your product page and how many of those visits turned into sales. This doesn’t just reveal which products are selling well, but also highlights which items are getting traffic but failing to convert.
At the same time, Seller Central Analytics is a powerful tool not only for monitoring sales numbers but also for understanding customer behavior. Key metrics to track include the Buy Box percentage, orders per session, and ASIN-level performance. For instance, if a product’s Buy Box percentage is low, it may be necessary to recheck pricing, inventory management, or fulfillment options. Similarly, a low orders-per-session rate can indicate issues in product descriptions or problems with ad optimization.
What truly makes a difference for sellers is turning these reports into strategy through regular monitoring. Seeing which products gain more traffic from specific ad campaigns, identifying categories with rising competition, or tracking peak hours of sales helps you allocate your budget wisely. In short, Amazon Business Reports and Seller Central Analytics are not just reporting tools—they serve as roadmaps to higher profitability. With consistent tracking and the right interpretation, you can optimize your sales and stay a step ahead of your competitors.


